https://www.zillow.com/research/mortgage-rate-lock-in-sellers-33886/
The so-called mortgage rate lock-in effect has proven to be a powerful motivator for keeping homeowners in their current homes, and it has drastically impacted both home sales and inventory. While the purchase of homes in recent months has led the share of borrowers with outstanding mortgage rates above 6 percent to rise, the large majority of mortgaged homeowners still possess a loan with a rate well below what would be quoted today.
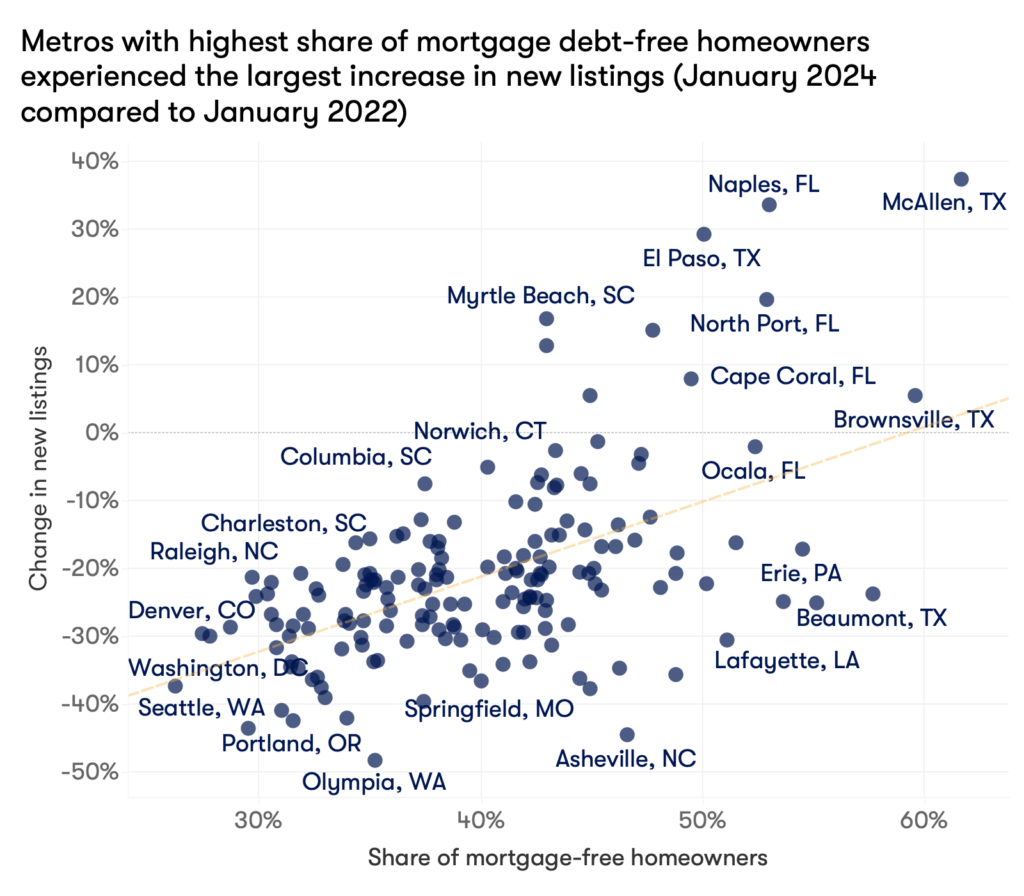
But a sizable chunk of homeowners should be immune to the effect of mortgage rate lock-in, due to the fact that they are both mortgage-free and continue to earn enough income to potentially afford the purchase of a new home. Many of these people are located in areas that have seen the most notable increase in new listings in the last couple years – further highlighting the grip that mortgage rate lock-in has had on the housing market.
Who could be in the position to sell?
Research shows that mortgage rate lock-in led to a 18% reduction in the probability of a home sale for every percentage point that market mortgage rates exceeded a homeowners’ origination mortgage rate, thus preventing roughly 1.33 million transactions between the second quarter of 2022 and the end of 2023. The supply reduction increased home prices by 5.7%, even as demand for housing slowed amid very challenging affordability conditions.
The reason why is that, for many homeowners – especially those with a low pandemic-era mortgage rate – the cost of selling has gone up. That’s because selling would likely result in trading a low mortgage payment for a much higher housing cost. With interest rates as high as they are, the price at which homeowners are indifferent between sitting on the sidelines and selling their home also remains elevated, though it varies greatly across households and regions. A large factor in this is, of course, a household’s current mortgage payment.
But some homeowner households have more flexibility than others. While the large majority of homeowners have a mortgage rate well below the prevailing rate or an income too low to comfortably afford a higher rate mortgage, 10.8 million (13%) of them are both mortgage-free and “mortgage-ready”, meaning that they can comfortably afford a new mortgage, even at the currently-quoted rate (near 7% at time of writing).
Unsurprisingly, most of these homeowners belong to older generations, having built equity in their home(s) over the span of many years, and/or those who live in more affordable markets.
The Silent Generation and Boomers Are Least Likely Affected By Changes In Mortgage Rates
| Generation | Total Homeowners | Mortgage Free Homeowners | Mortgage Free and Mortgage Ready Homeowners | Percentage Free of Rate Lock-In |
| Silent Gen | 8,780,278 | 6,685,928 | 1,249,895 | 14% |
| Boomers | 32,061,195 | 17,430,503 | 5,305,625 | 17% |
| Gen X | 24,784,630 | 6,884,541 | 3,018,890 | 12% |
| Millennials | 17,627,307 | 3,202,861 | 1,127,771 | 6% |
| Gen Z | 1,273,088 | 332,842 | 48,434 | 4% |
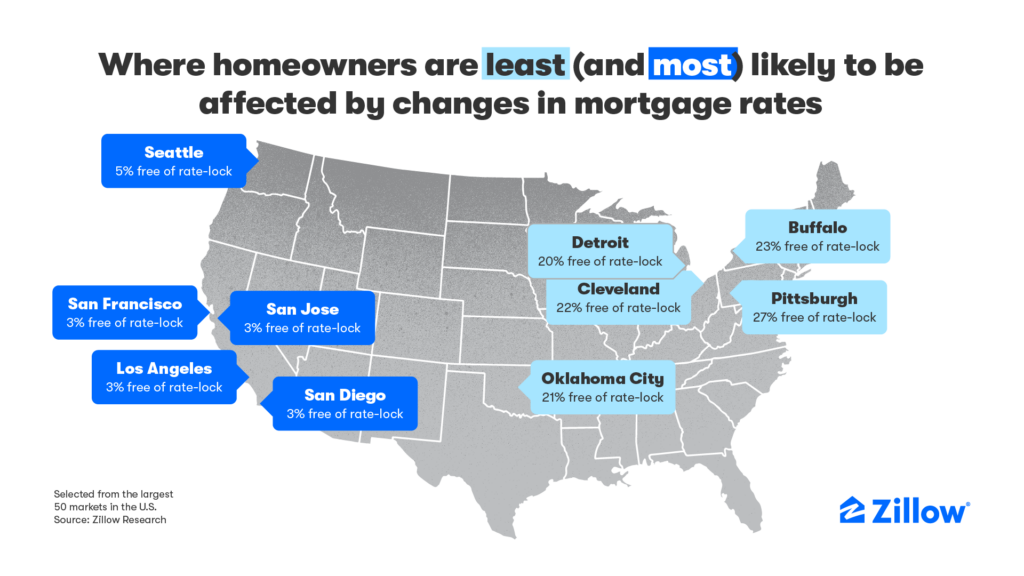
Metros Where Homeowners Are Least Likely To Be Affected By Changes In Mortgage Rates

| MSA | Total Homeowners | Mortgage Free Homeowners | Mortgage Free and Mortgage Ready Homeowners | Percentage Free of rate-lock |
| Pittsburgh, PA | 699,477 | 341,063 | 188,486 | 27% |
| Buffalo, NY | 332,770 | 160,048 | 76,078 | 23% |
| Cleveland, OH | 561,134 | 241,587 | 123,707 | 22% |
| Oklahoma City, OK | 344,916 | 143,428 | 70,763 | 21% |
| Detroit, MI | 1,227,113 | 524,087 | 239,813 | 20% |
How mortgage rate lock-in (or lack thereof) compares to the recent uptick in listing activity
The flow of new listings to the market rose substantially in February, marking a 21% increase from the same month last year. February’s new for-sale listing activity was still well below what the market would expect prior to the pandemic, and total for-sale inventory remains even further behind. Much of the monthly increase occurred in markets which have a disproportionately higher number of homeowners that aren’t hamstrung by mortgage rate lock-in.

It’s important to note that a homeowner’s lack of a mortgage and sufficient income isn’t necessarily the reason why they would list their home. There are of course many reasons why people decide to move, including, but not limited to, major life events, changes in family size, job changes, and many others. However, housing affordability is likely an important factor. Although the share of households that move has been declining, relatively more affordable housing markets have seen a smaller decrease in residential mobility.
Metros Where Homeowners Are Most Likely To Be Affected By Change In Mortgage Rates
| MSA | Total Homeowners | Mortgage Free Homeowners | Mortgage Free and Mortgage Ready Homeowners | Percentage Free of rate-lock |
| San Diego, CA | 641,052 | 201,114 | 18,315 | 3% |
| San Jose, CA | 357,221 | 125,670 | 10,848 | 3% |
| Los Angeles, CA | 2,161,234 | 731,526 | 67,755 | 3% |
| San Francisco, CA | 914,825 | 320,039 | 30,978 | 3% |
| Seattle, WA | 964,005 | 298,755 | 44,584 | 5% |
METHODOLOGY
The percentage of homeowners who are “free of rate-lock” is measured as the share of homeowners who 1) do not have a mortgage and 2) would face a monthly mortgage cost that is 30% or less than their reported household income if they borrowed to purchase the typical home in their metropolitan area.
This analysis assumes a homeowner household can only afford a 3% down payment at the highest home value – measured by ZHVI – in their metropolitan area and the highest mortgage rate recorded each year based on applications submitted to the Freddie Mac from lenders across the country.
A lower down payment implies higher monthly mortgage payments, raising the threshold income needed to be considered mortgage ready in this analysis.
We also assume PMI is 1% of the original loan amount. These assumptions make our estimates a lower bound for the number of homeowner households that could take on a new mortgage payment since most buyers (88%) had a down payment larger than 3% in 2022.
Zillow data is used for new listings and the typical home value in each metropolitan area. Household counts by tenure and mortgage status come from IPUMS USA. Steven Ruggles, Sarah Flood, Matthew Sobek, Daniel Backman, Annie Chen, Grace Cooper, Stephanie Richards, Renae Rogers, and Megan Schouweiler. IPUMS USA: Version 14.0 [dataset]. Minneapolis, MN: IPUMS, 2023. https://doi.org/10.18128/D010.V14.0


